Overview¶
TPP is a software tool for processing raw reads (e.g. .fastq files, untrimmed) from an Tn-Seq experiment, extracting counts of transposon insertions at individual TA dinucleotides sites in a genome (“read counts”, or more specifically “template counts”, see below), and writing this information out in .wig format suitable for input to TRANSIT. In addition, TPP calculates some useful statistics and diagnostics on the dataset.
There are many way to do pre-processing of Tn-Seq datasets, and it can depend on the the protocol used for Tn-Seq, the conventions used by the sequencing center, etc. However, TPP is written to accommodate the most common situation among our collaborating labs. In particular, it is oriented toward the Tn-Seq protocol developed in the Sassetti lab and described in (Long et al, 2015), which uses a barcoding system to uniquely identifying reads from distinct transposon-junction DNA fragments. This allows raw read counts to be reduced to unique template counts, eliminating effects of PCR bias. The sequencing must be done in paired-end (PE) mode (with a minimum read-length of around 50 bp). The transposon terminus appears in the prefix of read1 reads, and barcodes are embedded in read2 reads.
The suffixes of read1 and read2 contain nucleotides from the genomic region adjacent to the transpsoson insertion. These subsequences must be mapped into the genome. TPP uses BWA (Burroughs-Wheeler Aligner) to do this mapping. It is a widely-used tool, but you will have to install it on your system. Mapping large datasets takes time, on the order of 15 minutes (depending on many factors), so you will have to be patient.
Subsequent to the BWA mapping step, TPP does a bunch of post-processing steps. Primarily, it tabulates raw read counts at each TA site in the reference genome, reduces them to template counts, and writes this out in .wig format (as input for TRANSIT). It also calculates and reports some statistics on the dataset which a useful for diagnostic purposes. These are saved in local file caled “.tn_stats”. The GUI automatically reads all the .tn_stats files from previously processed datasets in a directory and displays them in a table.
The GUI interface is set-up basically as a graphical front-end that allows you to specify input files and parameters to get a job started. Once you press START, the graphical window goes away, and the pre-processing begins, printing out status messages in the original terminal window. You can also run TPP directly from the command-line with the GUI, by providing all the inputs via command-line arguments.
TPP has a few optional parameters in the interface. We intend to add other options in the future, so if you have suggestions, let us know. In particular, if you have some datasets that requires special processing (such as if different primer sequences were used for PCR amplification, or a different barcoding system, or different contaminant sequences to search for, etc.), we might be able to add some options to deal with this.
Installation¶
TPP should work equivalently on Macs, PCs running Windows, or Unix machines. TPP is fundamentally a python script that has a graphical user interface (GUI) written in wxPython. Its major dependency is that it calls BWA to map reads. TPP has the following requirements. If these are not already on your system, you will have to install them manually.
Requirements:
- python version 2.7
- wxPython 3.0.1 (the ‘cocoa’ version)
- BWA version 0.7.12 (can put this directory anywhere; be sure to run ‘make’ to build bwa executable
Since TPP is a python script, there is nothing to compile or ‘make’.
Running TPP¶
TPP may be run from the command line (e.g. of a terminal window or shell) by typing:
python PATH/src/tpp.py
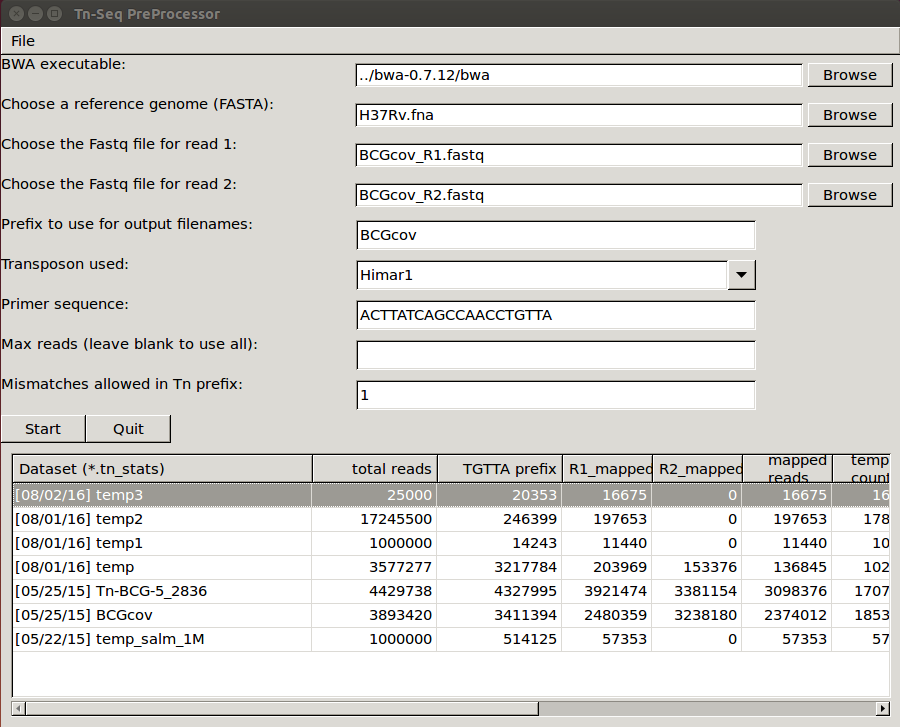
where PATH is the path to the TRANSIT installation directory. This should pop up the GUI window, looking like this…
Note, TPP can process paired-end reads, as well as single-end datasets. (just leave the filename for read2 blank)
The main fields to fill out in the GUI are…
- bwa executable - you’ll have to find the path to where the executable is installed
- reference genome - this is the sequence in Fasta format against which the reads will be mapped
- reads1 file - this should be the raw reads file (untrimmed) for
read1 in FASTQ or
FASTA format, e.g.
DATASET_NAME_R1.fastq
- Note: you can also supply gzipped files for reads, e.g. *.fastq.gz
- reads2 file - this should be the raw reads file (untrimmed) for
read2 in FASTQ or FASTA format, e.g. DATASET_NAME_R2.fastq
- Note: if you leave read2 blank, it will process the dataset as single-ended. Since there are no barcodes, each read will be counted as a unique template.
- prefix to use for output filename (for the multiple intermediate files that will get generated in the process; when you pick datasets, a temp file name will automatically be suggested for you, but you can change it to whatever you want)
- transposon used - Himar1 is assumed by default, but you can set it to Tn5 to process libraries of that type. The main consequences of this setting are: 1) the selected transposon determines the nucleotide prefix to be recognized in read 1, and 2) for Himar1, reads are counted only at TA sites, whereas for Tn5, reads are counted at ALL sites in the genome (since it does not have significant sequence specificity) and written out in the .counts and .wig files.
- primer sequence - This represents the end of the transposon that appears as a constant prefix in read 1 (possibly shifted by a few random bases), resulting from amplifying transposon:genomic junctions. TPP searches for this prefix and strips it off, to map the suffixes of reads into the genome. TPP has default sequences defined for both Himar1 and Tn5 data, based on the most commonly used protocols (Long et al. (2015); Langridge et al. (2009)). However, if you amplify junctions with a different primer, this field gives you the opportunity to change the sequence TPP searches for in each read. Note that you should not entirer the ENTIRE primer sequence, but rather just the part of the primer sequence that will show up at the beginning of every read.
- max reads - Normally, leave this blank by default, and TPP will process all reads. However, if you want to do a quick run on a subset of the data, you can select a smaller number. This is mainly for testing purposes.
- mismatches - this is for searching for the sequence patterns in reads corresponding to the transposon prefix in R1 and the constant adapter sequences surrounding the barcode in R2; we suggest using a default value of 1 mismatch
Once you have filled all these fields out, you can press START (or QUIT). At this point the GUI window will disappear, and the data processing commences in the original terminal/shell windows. It prints out a lot of information to let you know what it is doing (and error messages, if anything goes wrong). Many intermediate files get generated. It takes awhile (like on the order of 15 minutes), most of which is taken up by the mapping-reads step by BWA.
Subsequent to the BWA mapping step, TPP does a bunch of post-processing steps. Primarily, it tabulates raw read counts at each TA site in the reference genome, reduces them to template counts, and writes this out in .wig format (as input for essentiality analysis in TRANSIT). It also calculates and reports some statistics on the dataset which a useful for diagnostic purposes. These are saved in local file caled “.tn_stats”. The GUI automatically reads all the .tn_stats files from previously processed datasets in a directory and displays them in a table.
TPP uses a local config file called “tpp.cfg” to rememeber parameter settings from run to run. This makes it convenient so that you don’t have to type in things like the path to the BWA executable or reference genome over and over again. You just have to do it once, and TPP will remember.
Command-line mode: TPP may be run on a dataset directly from the command-line without invoking the user interface (GUI) by providing it filenames and parameters as command-line arguments.
For a list of possible command line arguments, type: python tpp.py -help
usage: python TRANSIT_PATH/src/tpp.py -bwa PATH_TO_EXECUTABLE -ref REF_SEQ -reads1 PATH_TO_FASTQ_OR_FASTA_FILE [-reads2 PATH_TO_FASTQ_OR_FASTA_FILE] -output OUTPUT_BASE_FILENAME [-maxreads N] [-tn5|-himar1] [-primer <seq>]
The input arguments and file types are as follows:
| Flag | Value | Comments |
|---|---|---|
| -bwa | path executable | |
| -ref | reference genome sequence | FASTA file |
| -reads1 | file of read 1 of paired reads | FASTA or FASTQ format (or gzipped) |
| -reads2 | file of read 2 of paired reads (optional for single-end reads | FASTA or FASTQ format (or gzipped) |
| -output† | base filename to use for output files | |
| -maxreads | subset of reads to process (optional); if blank, use | |
| -mismatches | how many to allow when searching reads for sequence patterns | |
| -tn5 | process reads as a Tn5 library (Himar1 is assumed by default | Reads mapping to any site will be considered. |
| -himar1 | process reads as a Himar1 library (assumed by default) | Considers reads that map to TA sites only. |
| -primer | nucleotide sequence | Constant prefix of reads that TPP searches for. |
† In earlier versions of Transit, this flag used to be ‘-prefix’, but we changed it to ‘-output’
(Note: if you have already run TPP once, the you can leave out the specification of the path for BWA, and it will automatically take the path stored in the config file, tpp.cfg. Same for ref, if you always use the same reference sequence.)
Overview of Data Processing Procedure¶
Here is a brief summary of the steps performed in converting raw reads (.fastq files) into template counts:
- Convert .fastq files to .fasta format (.reads).
- Identify reads with the transposon prefix in R1 . The sequence searched for is ACTTATCAGCCAACCTGTTA (or TAAGAGACAG for Tn5), which must start between cycles 5 and 10 (inclusive). (Note that this ends in the canonical terminus of the Himar1 transposon, TGTTA.) The “staggered” position of this sequence is due to insertion a few nucleotides of variable length in the primers used in the Tn-Seq sample prep protocol (e.g. 4 variants of Sol_AP1_57, etc.). The number of mimatches allowed in searching reads for the transposon sequence pattern can be adjusted as an option in the interface; the default is 1.
- Extract genomic part of read 1. This is the suffix following the transposon sequence pattern above. However, for reads coming from fragments shorter than the read length, the adapter might appear at the other end of R1, TACCACGACCA. If so, the adapter suffix is stripped off. (These are referred to as “truncated” reads, but they can still be mapped into the genome just fine by BWA.) The length of the genomic part must be at least 20 bp.
- Extract barcodes from read 2. Read 2 is searched for GATGGCCGGTGGATTTGTGnnnnnnnnnnTGGTCGTGGTAT”. The length of the barcode is typically 10 bp, but can be varaible, and must be between 5-15 bp.
- Extract genomic portions of read 2. This is the part following TGGTCGTGGTAT…. It is often the whole suffix of the read. However, if the read comes from a short DNA fragment that is shorter than the read length, the adapter on the other end might appear, in which case it is stripped off and the nucleotides in the middle representing the genomic insert, TGGTCGTGGTATxxxxxxxTAACAGGTTGGCTGATAAG. The insert must be at least 20 bp long (inserts shorter than this are discarded, as they might map to spurious locations in the genome).
- Map genomic parts of R1 and R2 into the genome using BWA. Mismatches are allowed, but indels are ignored. No trimming is performed. BWA is run in ‘sampe’ mode (treating reads as pairs). Both reads of a pair must map (on opposite strands) to be counted.
- Count the reads mapping to each TA site in the reference genome (or all sites for Tn5).
- Reduce raw read counts to unique template counts. Group reads by barcode AND mapping location of read 2 (aka fragment “endpoints”).
- Output template counts at each TA site in a .wig file.
- Calculate statistics like insertion_density and NZ_mean. Look for the site with the max template count. Look for reads matching the primer or vector sequences.
Statistics¶
Here is an explanation of the statistics that are saved in the .tn_stats file and displayed in the table in the GUI. For convenience, all the statistics are written out on one line with tab-separation at the of the .tn_stats file, to make it easy to add it as a row in a spreadsheet, as some people like to do to track multiple datasets.
| Statistic | Description |
|---|---|
| total_reads | total number of reads in the original .fastq/.fasta |
| truncated_reads | reads representing DNA fragments shorter than the read length; adapter appears at end of read 1 and is stripped for mapping |
| TGTTA_reads | number of reads with a proper transposon prefix (ending in TGTTA in read1) |
| reads1_mapped | number of R1 mappped into genome (independent of R2) |
| reads2_mapped | number of R2 mappped into genome (independent of R1) |
| mapped_reads | number of reads which mapped into the genome (requiring both read1 and read2 to map) |
| read_count | total reads mapping to TA sites (mapped reads excluding those mapping to non-TA sites) |
| template_count | reduction of mapped reads to unique templates using barcodes |
| template_ratio | read_count / template_count |
| TA_sites | total number of TA dinucleotides in the genome |
| TAs_hit | number of TA sites with at least 1 insertion |
| insertion_density | TAs_hit / TA_sites |
| max_count | the maximum number of templates observed at any TA site |
| max_site | the coordinate of the site where the max count occurs |
| NZ_mean | mean template count over non-zero TA sites |
| FR_corr | correlation between template counts on Fwd strand versus Rev strand |
| BC_corr | correlation between read counts and template counts over non-zero sites |
| primer_matches | how many reads match the Himar1 primer sequence (primer-dimer problem in sample prep) |
| vector_matches | how many reads match the phiMycoMarT7 sequence (transposon vector) used in Tn mutant library construction |
| adapter | how many reads match the Illumina adapter (primer-dimers, no inserts). |
| misprimed | how many reads match the Himar1 primer but lack the TGTTA, meaning they primed at random sites (non-Tn junctions) |
Here is an example of a .tn_stats file:
# title: Tn-Seq Pre-Processor
# date: 08/03/2016 13:01:47
# command: python ../../src/tpp.py -bwa /pacific/home/ioerger/bwa-0.7.12/bwa -ref H37Rv.fna -reads1 TnSeq_H37Rv_CB_1M_R1.fastq -reads2 TnSeq_H37Rv_CB_1M_R2.fastq -output TnSeq_H37Rv_CB
# transposon type: Himar1
# read1: TnSeq_H37Rv_CB_1M_R1.fastq
# read2: TnSeq_H37Rv_CB_1M_R2.fastq
# ref_genome: H37Rv.fna
# total_reads 1000000 (or read pairs)
# TGTTA_reads 977626 (reads with valid Tn prefix, and insert size>20bp)
# reads1_mapped 943233
# reads2_mapped 892527
# mapped_reads 885796 (both R1 and R2 map into genome)
# read_count 879663 (TA sites only, for Himar1)
# template_count 605660
# template_ratio 1.45 (reads per template)
# TA_sites 74605
# TAs_hit 50382
# density 0.675
# max_count 356 (among templates)
# max_site 2631639 (coordinate)
# NZ_mean 12.0 (among templates)
# FR_corr 0.821 (Fwd templates vs. Rev templates)
# BC_corr 0.990 (reads vs. templates, summed over both strands)
# primer_matches: 10190 reads (1.0%) contain CTAGAGGGCCCAATTCGCCCTATAGTGAGT (Himar1)
# vector_matches: 5608 reads (0.6%) contain CTAGACCGTCCAGTCTGGCAGGCCGGAAAC (phiMycoMarT7)
# adapter_matches: 0 reads (0.0%) contain GATCGGAAGAGCACACGTCTGAACTCCAGTCAC (Illumina/TruSeq index)
# misprimed_reads: 6390 reads (0.6%) contain Himar1 prefix but don't end in TGTTA
# read_length: 125 bp
# mean_R1_genomic_length: 92.9 bp
# mean_R2_genomic_length: 79.1 bp
TnSeq_H37Rv_CB_1M_R1.fastq  TnSeq_H37Rv_CB_1M_R2.fastq  1000000 977626  943233  892527  885796  879663  605660  1.45240398904   74605   50382   356 0.675316667784  2631639 12.0213568338   0.8209081083    0.989912222642  10190   5608    0   6390
Interpretation: To assess the quality of a dataset, I would recommend starting by looking at 3 primary statistics:
- mapped reads: should be on the order of several million mapped_reads; if there is a significant reduction from total_reads, look at reads1_mapped and reads2_mapped and truncated_reads to figure what might have gone wrong; you might try allowing 2 mismatches
- primer/vector_matches: check whether a lot of the reads might be matching the primer or vector sequences; if they match the vector, it suggests your library still has phage contamination from the original infection; if there are a lot of primer reads, these probably represent “primer-dimers”, which could be reduced by inproving fragment size selection during sample prep.
- insertion density: good libraries should have insertions at ≥ ~35% of TA sites for statistical analysis
- NZ_mean: good datasets should have a mean of around 50 templates per site for sufficient dynamic range
If something doesn’t look right, the other statistics might be helpful in figuring out what went wrong. If you see a significant reduction in reads, it could be due to some poor sequencing cycles, or using the wrong reference genome, or a contaminant of some type. Some attrition is to be expected (loss of maybe 10-40% of the reads). The last 2 statistics indicate 2 common cases: how many reads match the primer or vector sequences. Hopefully these counts will be low, but if they represent a large fraction of your reads, it could mean you have a problem with your sample prep protocol or Tn mutant library, respectively.
Comments or Questions?
TPP was developed by Thomas R.
Ioerger at Texas A&M
University. If you have any comments or questions, please feel free to
send me an email at: ioerger@cs.tamu.edu